The restaurant and hospitality industry consistently records some of the highest employee turnover rates of any sector in the U.S. economy.
Since 2001, the accommodation and food services sector has had an average annual turnover rate of 75.6%. This is substantially higher than the broader economy’s average of 43.4% over the same period.
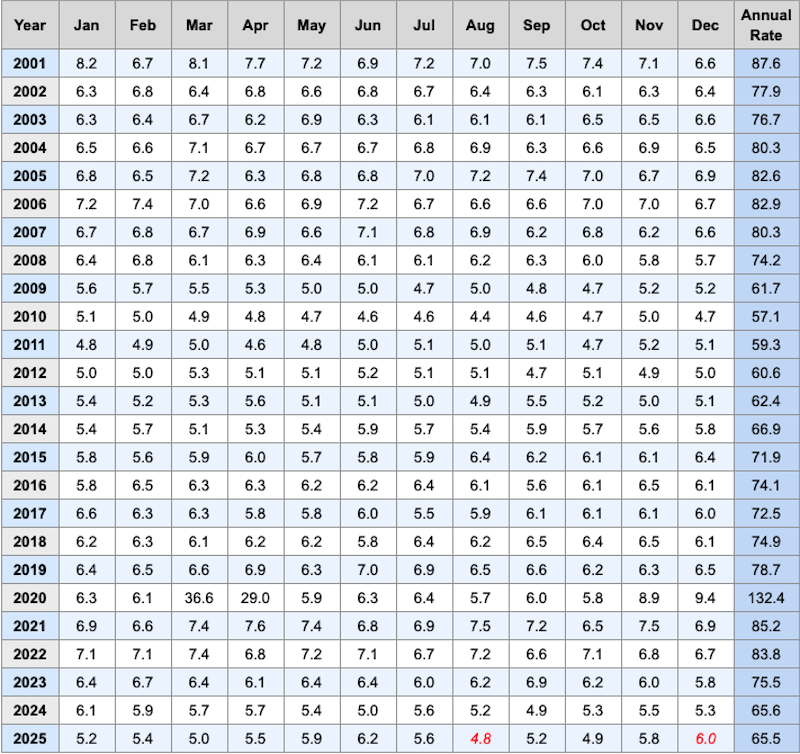
The sector’s annual turnover rate was 65.5% in 2025, the most recent full year of data available.
These findings are derived from the U.S. Bureau of Labor Statistics, which collects data on American workers and employers.
Restaurant and Hospitality Industry Annual Turnover Rate, 2001 – 2025
*Note: Red numbers indicate preliminary data.
Understanding the Data
The figures above reflect the total separations rate for the accommodation and food services sector as reported by the U.S. Bureau of Labor Statistics’ Job Openings and Labor Turnover Survey (JOLTS). This sector includes restaurants, hotels, bars, and other hospitality businesses. Total separations encompasses voluntary quits, layoffs, discharges, and other separations.
The Restaurant and Hospitality Industry Has Persistently High Turnover
Going back to 2001—the earliest year for which this data is available—the accommodation and food services sector has averaged 75.6% annual turnover. Even excluding the anomalous 2020 pandemic year, the long-term average holds at 73.3%.
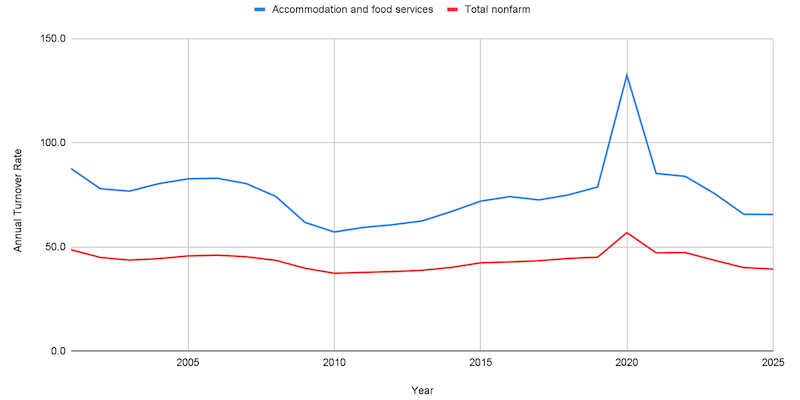
By comparison, total nonfarm employment averaged 43.4% over the same period, meaning turnover in the restaurant and hospitality industry is more than 1.7 times higher than the national average.
Restaurant and Hospitality Turnover Consistently Outpaces Broader Economy
Since 2001, restaurant and hospitality turnover has been 74.3% higher than the overall economy (75.6% vs. 43.4%)
The COVID-19 Pandemic Had an Outsized Impact on the Industry
In 2020, the restaurant and hospitality sector recorded a 132.4% annual turnover rate, more than any other year by a wide margin. The sharpest disruption came in March and April 2020, when pandemic-related shutdowns were widespread; those two months alone saw a combined turnover of 65.6%, nearly a full year’s worth of separations in just 60 days. The speed and scale of that labor market shock underscores just how exposed the industry was—and is—to disruption.
From 2021 through 2025 turnover in the sector has averaged 75.1%, closely tracking the long-term historical average and suggesting the industry has largely normalized following pandemic-era volatility.
The Restaurant and Hospitality Industry May Be Indicating Recession Patterns
While industry turnover spiked during the pandemic, over the long term the rate tends to decline during periods of economic stress—when workers may be less willing to voluntarily leave jobs—and rise during periods of growth and labor market tightness.
This pattern is visible in the data. Turnover dropped significantly between 2009 and 2015 in the aftermath of the Great Recession, falling as low as 57.1% in 2010.
The industry’s 2024 and 2025 rates (65.6% and 65.5%, respectively) are closer to those recession-era lows than to the pre-pandemic highs of the mid-to-late 2010s, pointing to ongoing headwinds in the current operating environment.
Restaurant and Hospitality Turnover: An Ongoing Industry Challenge
While annual rates rise and fall with broader economic and social forces, high turnover remains a consistent challenge for the restaurant and hospitality industry. For operators, that makes workforce development a strategic priority rather than an afterthought. Escoffier Global Solutions works with foodservice and hospitality organizations to build the kind of training infrastructure that helps companies develop stronger teams and improve long-term retention.
FAQs
What is the restaurant industry’s average annual turnover rate?
According to Bureau of Labor Statistics JOLTS data, the accommodation and food services sector (which includes restaurants, hotels, and other hospitality businesses) has averaged 75.6% annual turnover between 2001 and 2025. The most recent full-year figure, for 2025, was 65.5%.
Why does the restaurant industry have high turnover?
Multiple factors drive above-average turnover in restaurants and hospitality, including a high proportion of part-time and hourly workers, seasonal fluctuations in business volume, and physically demanding working conditions. The industry also employs a large share of younger workers, who are likely to transition from employment to education or to another job (whether that be in the restaurant industry, or elsewhere).
How does restaurant industry turnover compare to the rest of the economy?
Between 2001 and 2025, the accommodation and food services sector averaged 75.6% annual turnover, compared to 43.4% for total nonfarm employment over the same period. That gap means the restaurant and hospitality industry has experienced 74.3% higher turnover than the broader economy, on average.
What happened to restaurant industry turnover during the COVID-19 pandemic?
2020 saw the highest turnover in the sector’s recorded history: 132.4% for the full year. The disruption was most acute in March and April 2020, when two months alone accounted for 65.6 percentage points of turnover as widespread shutdowns forced rapid workforce reductions across the industry.
Is restaurant industry turnover getting better or worse?
After spiking during the pandemic, turnover has stabilized. From 2021 to 2025, the sector averaged 75.1% annually, which is in line with long-term historical norms. However, 2024 and 2025 rates (65.5% and 65.5%, respectively) are notably lower than pre-pandemic peaks, suggesting that current economic conditions may be dampening worker mobility rather than reflecting a structural improvement in retention.
Sources
Data retrieved from the U.S. Bureau of Labor Statistics’ Job Openings and Labor Turnover Survey, accessed on March 3, 2026. Data for August and December 2025 is preliminary.
Series Id: JTS720000000000000TSR, Seasonally adjusted, Industry: Accommodation and food services, State/Region: Total US, Area: All areas, Data Element: Total separations, Size Class: All size classes, Rate/Level: Rate
Series Id: JTS000000000000000TSR, Seasonally adjusted, Industry: Total nonfarm, State/Region: Total US, Area: All areas, Data Element: Total separations, Size Class: All size classes, Rate/Level: Rate
Burnout is one reason restaurants lose good employees. Recognize the signs, address root causes, and build a kitchen culture where people want to stay.
Build a hospitality talent pipeline that cuts turnover and fills positions faster. Learn proven strategies to connect with qualified candidates early.
March 27, 2026
Subscribe to Our Blog
Get the latest training, hiring, and education insights from our experts to you.
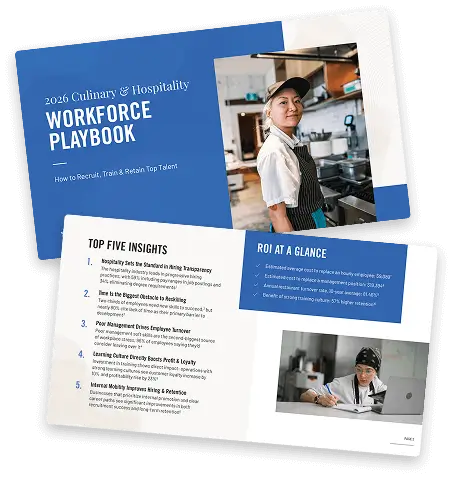
Get the 2026 Culinary & Hospitality Workforce Playbook
Access insights to recruit, train, and retain top culinary & hospitality talent.
Get My Workforce Playbook
Clicking the “Get the Guide Now” button constitutes your express request, and your express written consent, to be contacted by and to receive automated or pre-recorded calls, texts, messages, and/or emails via phone, text, and/or emails by Auguste Escoffier Global Solutions (AEGS) at the number(s)/email you provided, regarding services and products offered by AEGS. You understand that these calls, texts, messages, and/or emails may be generated using an automated or pre-recorded technology. You are not required to agree to receive automated or pre-recorded calls, texts, messages, or emails as a condition of participating in services and products offered by AEGS. You can unsubscribe at any time or request the removal of street address, phone number, and email address via the AEGS website.